

The housing market slump deepened in April with sales volumes dropping to a record low outside of the Covid lockdown period.
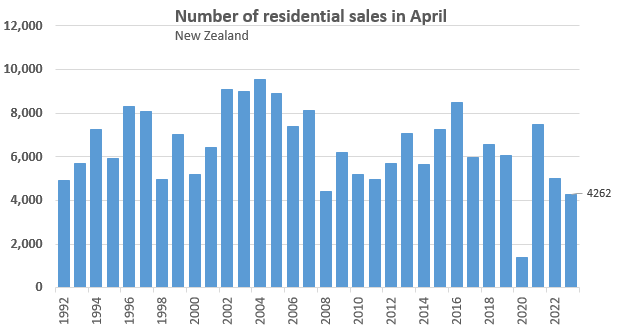
The Real Estate Institute of New Zealand (REINZ) recorded just 4262 residential property sales in April, down 15.3% compared to April last year. It’s the lowest number of sales recorded in the month of April since the REINZ began reporting sales in their current format in 1992, apart from April 2020 when the market was in a near total lockdown due to pandemic restrictions (see the first graph below).
In April 1992, 4929 residential properties were sold, which means sales are currently running 13.5% lower than they were 31 years ago.
Prices are also continuing to slide with the REINZ House Price Index (HPI) , which adjusts for differences in the mix of properties sold each month, declining another 0.8% in April.
The HPI is now down 12% nationally compared to April last year and down 17.5% from its November 2021 peak.
The amount of time it’s taking to sell properties also continues to stretch out, with the median days to sell rising to 47 in April, up by two days compared to March, and up by nine days compared to April last year.
The low level of sales is also having an effect on the amount of stock on the market, with the REINZ recording 28,643 residential properties for sale at the end of April. That’s down just 2.19% compared to March even though new listings dropped by 22.7% over the same period.
The biggest declines in sales were in the upper North Island, with April sales in Northland down 24.7% compared to April last year, followed by Auckland -23.0%, Waikato -20.0% and Taranaki -20.7%.
All up, the figures the figures paint a disastrous picture of the state of the housing market.
“New Zealanders are waiting for the peak of inflation, a settling in interest rates and some clarity around the outcome of this year’s election – this is what is keeping activity low,” REINZ Chief Executive Jen Baird said.
“However for those looking to buy, lower prices and good stock levels means there are opportunities as we head into the cooler months,” she said.
The second chart below shows the monthly sales volumes by region.
Select chart tabs


